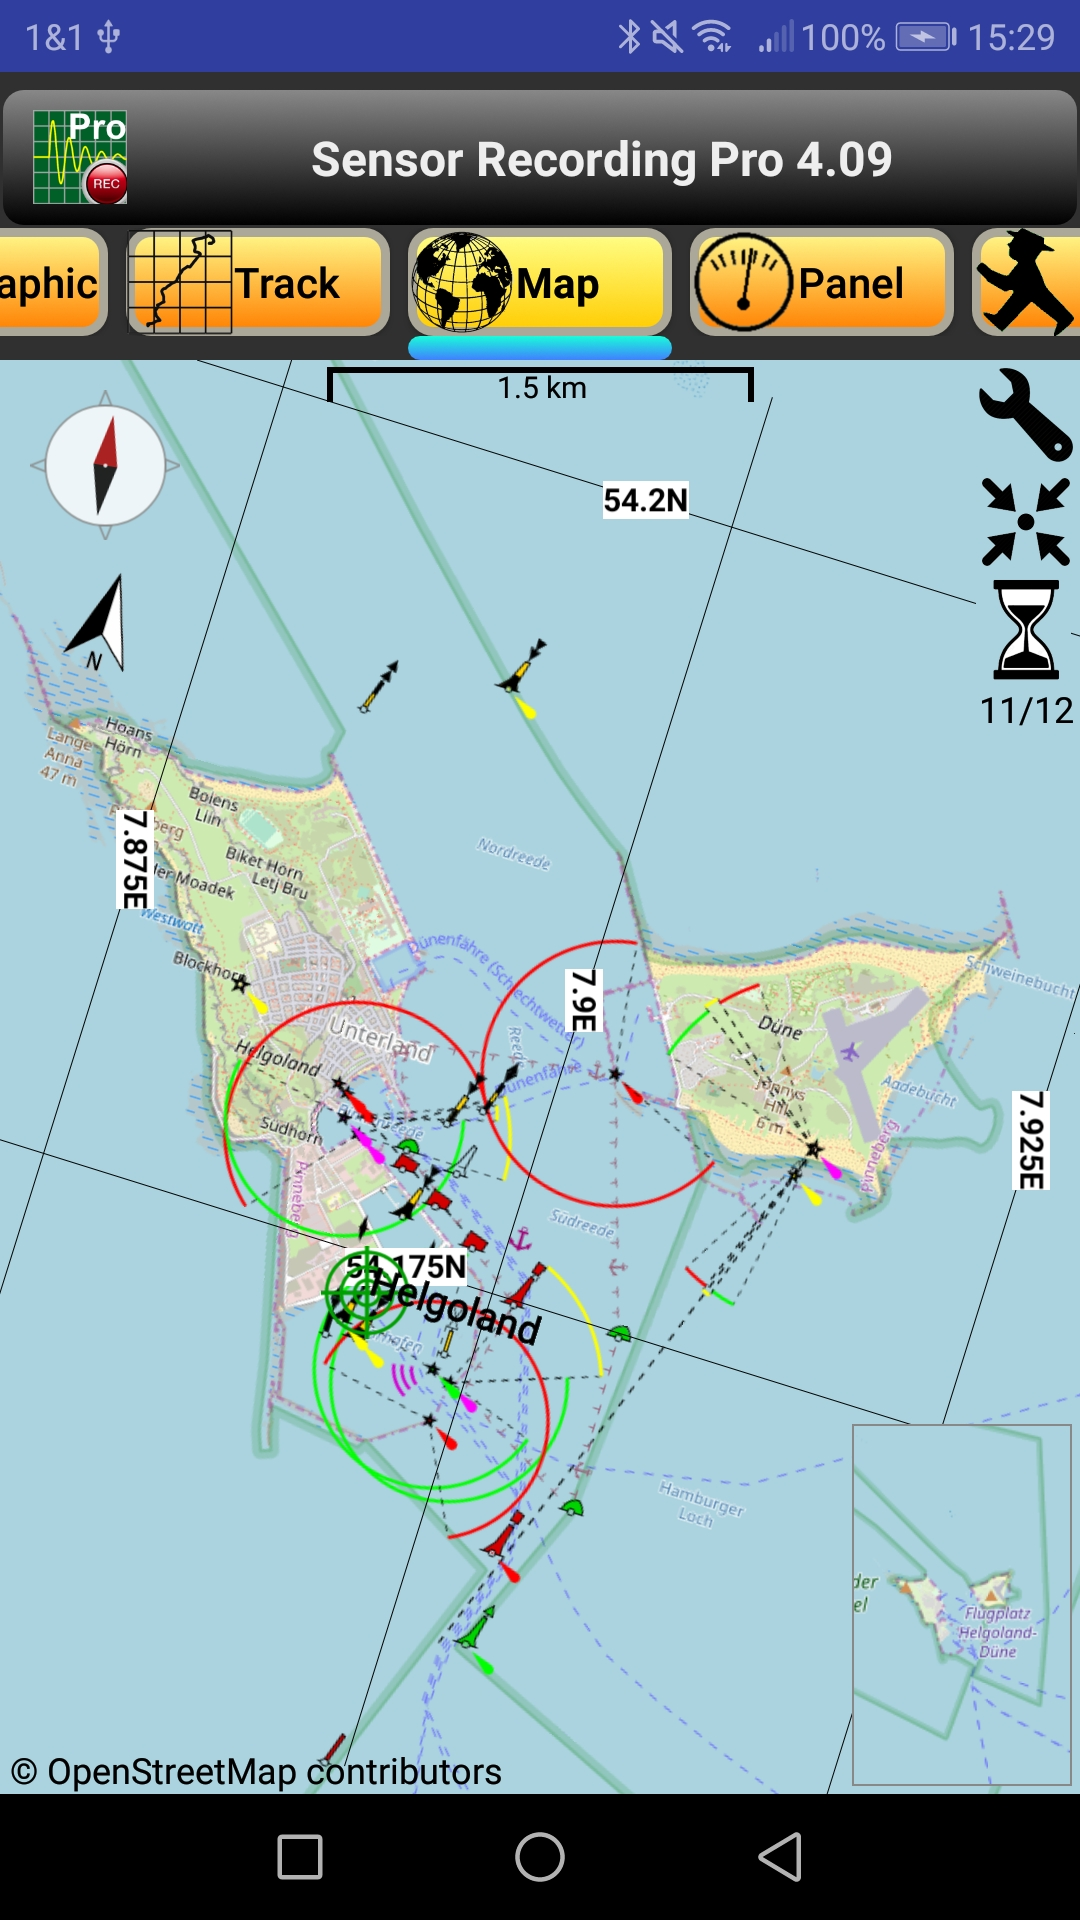
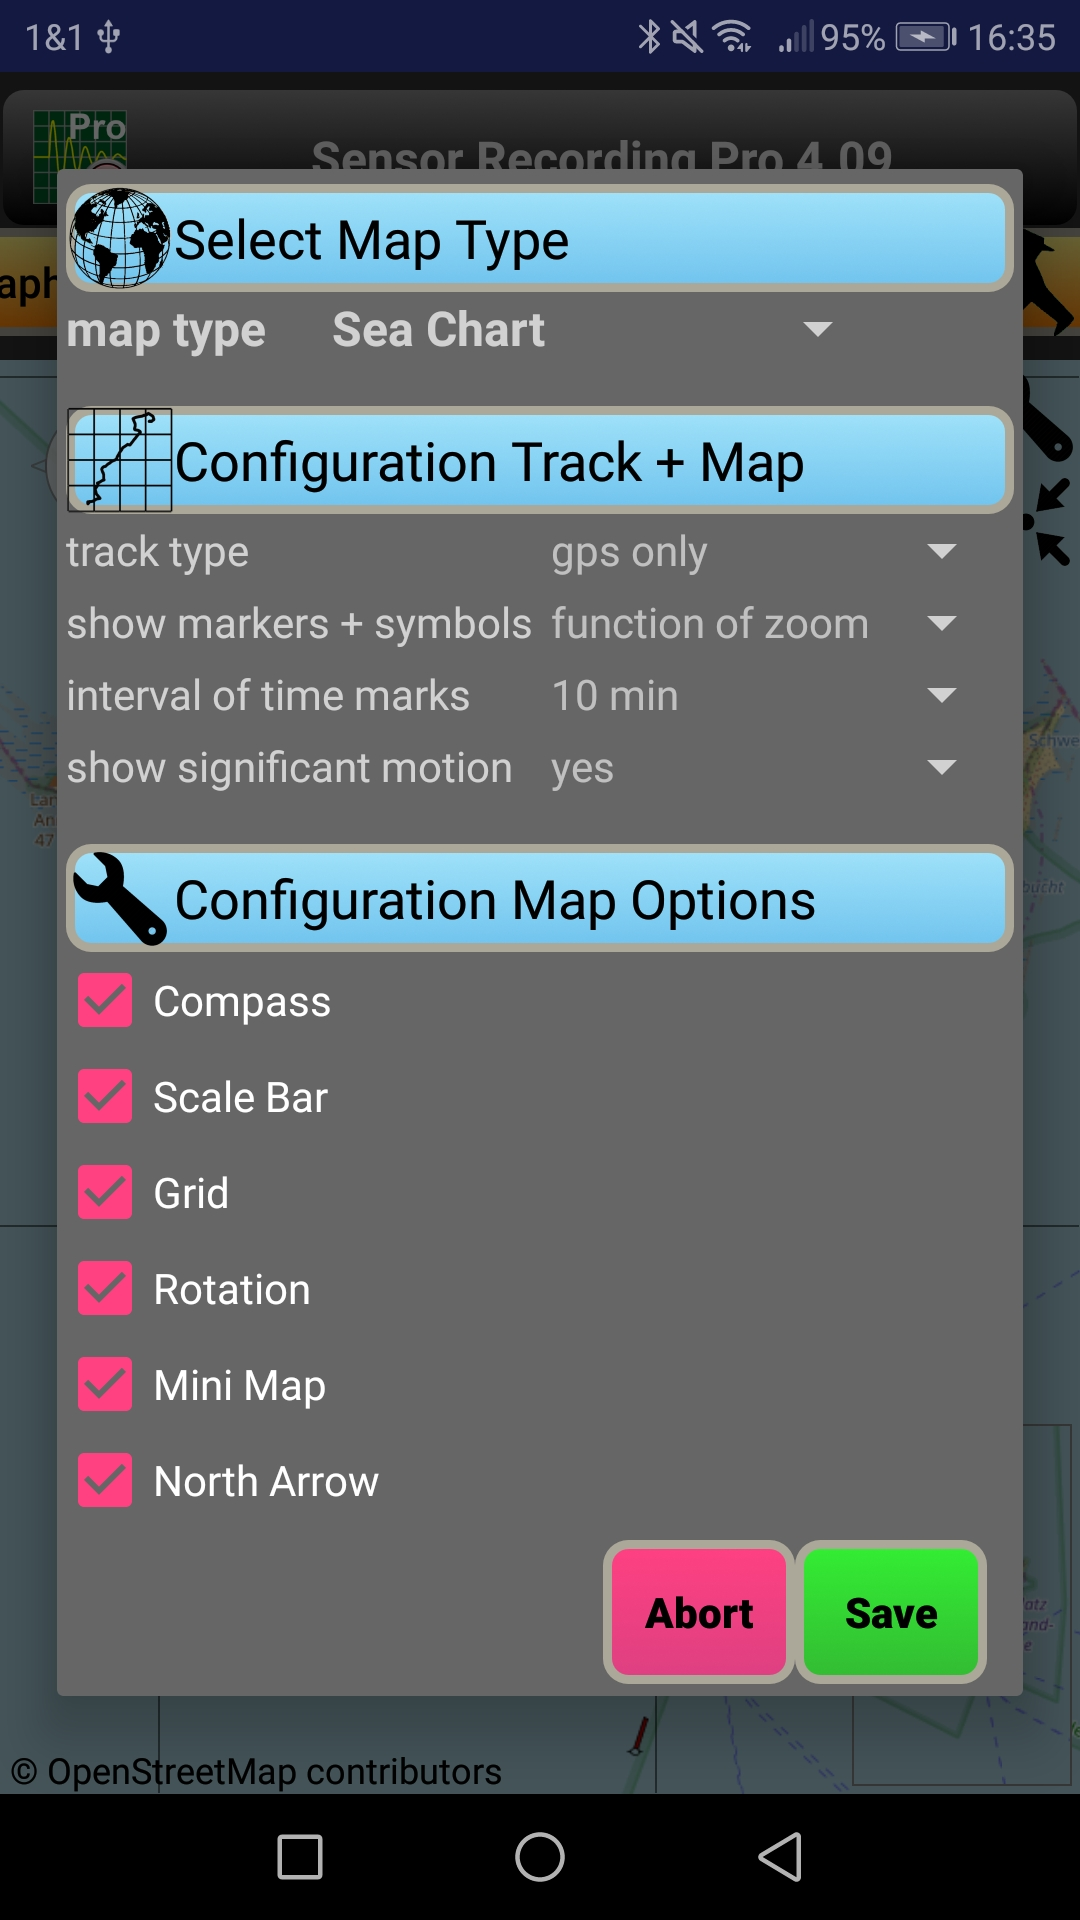
A click on the icon in the upper right corner opens a dialog. There are several options to configure the presentation in the display of "Map" and partly "Track" and "Graphic" as well - amongst others the map type and numerous map elements.
As of version 5.00 there is the option for inking the tracks with a free selectable sensor data set. The color table may be gray scale or rainbow colors. Furthermore, a slidable mini graphic with a histogram of the data distribution can be displayed. The access to the color table is done via this histogram.
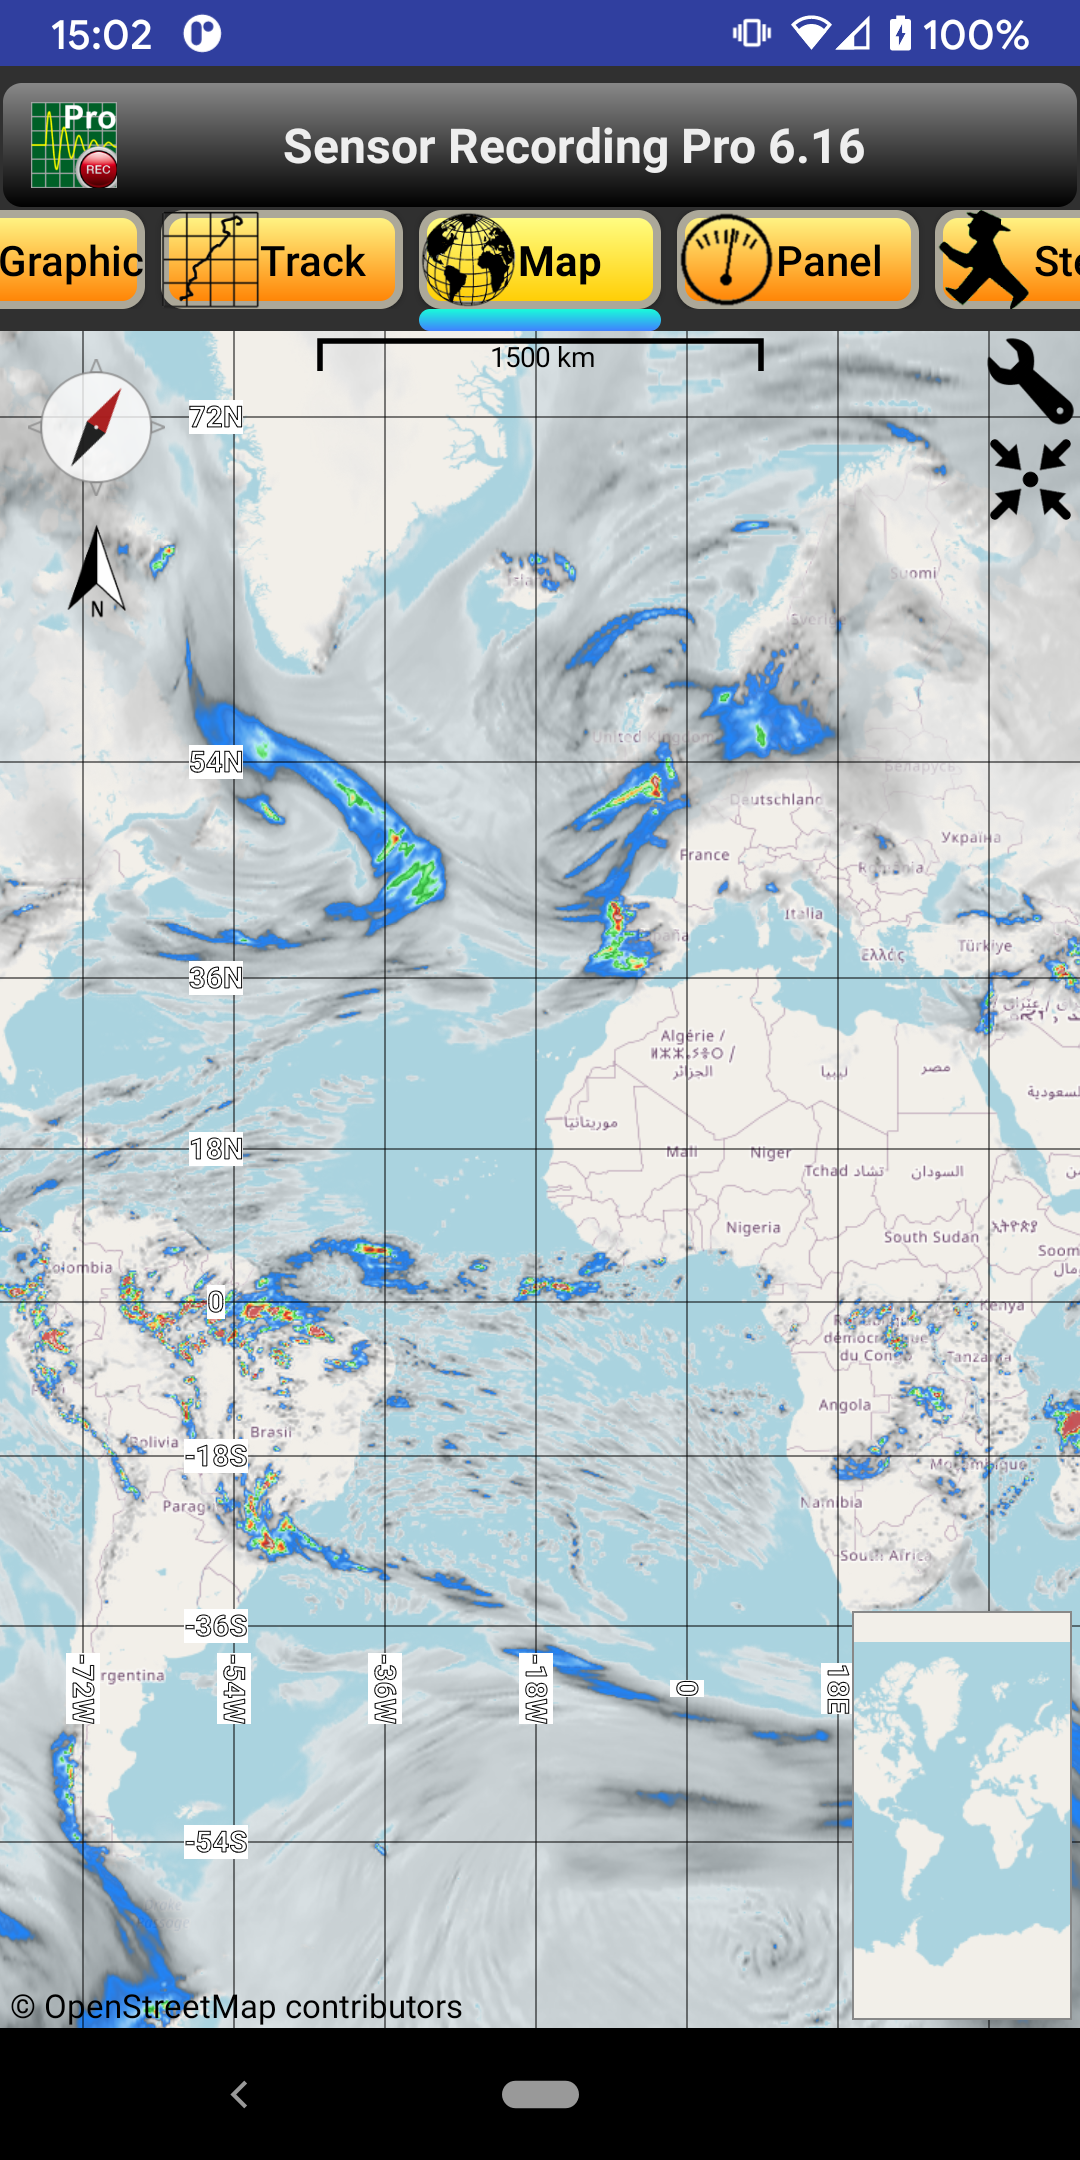
Since version 5.03 there are many weather maps worldwide - in different formats (satellite or rain radar). The base map is available in Mercator projection, unfortunately the overlaid weather maps are not. Therefore, they do not fit 100%, especially in the overlapping areas. Attention! Devices with little memory can cause problems if too many weather maps are active simultaneously. In this case, reduce the number of active maps. Older Android Versions (less than 6) may have problems to show weather maps with https - due to expired TLS certificates. See also Sectigo AddTrust. As of version 6.21 you have the option to ignore these certificates, if you are concerned.
A click on the 2nd icon from top centers the map. Another click causes the map to be centered continuously. In this mode the icon is gone. After a zoom or pan operation on the map, the center position stays fixed and the icon re-appears again.
The 3rd icon is an hourglass - initially red. When it's turning black, this indicates that the loading of map tiles is in progress. The text x/y below that icon shows the number of loaded tiles / total tiles. As soon as the download process is finished, the icon and text disappears. However, the hourglass remains red if there is no map coverage available for this map type and zoom level. In this case you should change the map type or zoom out a little bit.
As of version 6.16 there is the option to display an "open Weather map". For that, you need a personal API key, which is available free of charge on https://openweathermap.org/price. In the directory "SensorRecording" create a file named "APIkeys.ini". The related entry is "openWeatherAPIkey=YourPersonalApiKey".
Attention! With the free key, the number of calls is limited to 60 tiles/minute. When this value is reached, a warning is displayed and a short pause is taken. If you have a superior licence grade, adapt the upper limit for calls/minute in the file APIkeys.ini. The default entry is "openWeatherLimit=60".
As of version 7.04, there is an additional display of the current address in text form. This is either the actual GPS position (if the sensor function is "started") or the map center (if it is "stopped"), highlighted by a cross-hair. After a click on the magnifying glass symbol, an arbitrary address may be entered as text. The map is then centered on the calculated position. Since version 7.05, the address may also be entered by voice (after click on the microphone icon).
Since version 7.08, there is a check box named "Geogr. Boundaries" in the setup menu of the map. If checked, the map is overlaid with surrounding boxes for each data file with position data. At the upper right corner, the date of the recording is displayed. This shall provide the user a quick overview about the locations all recorded data files.
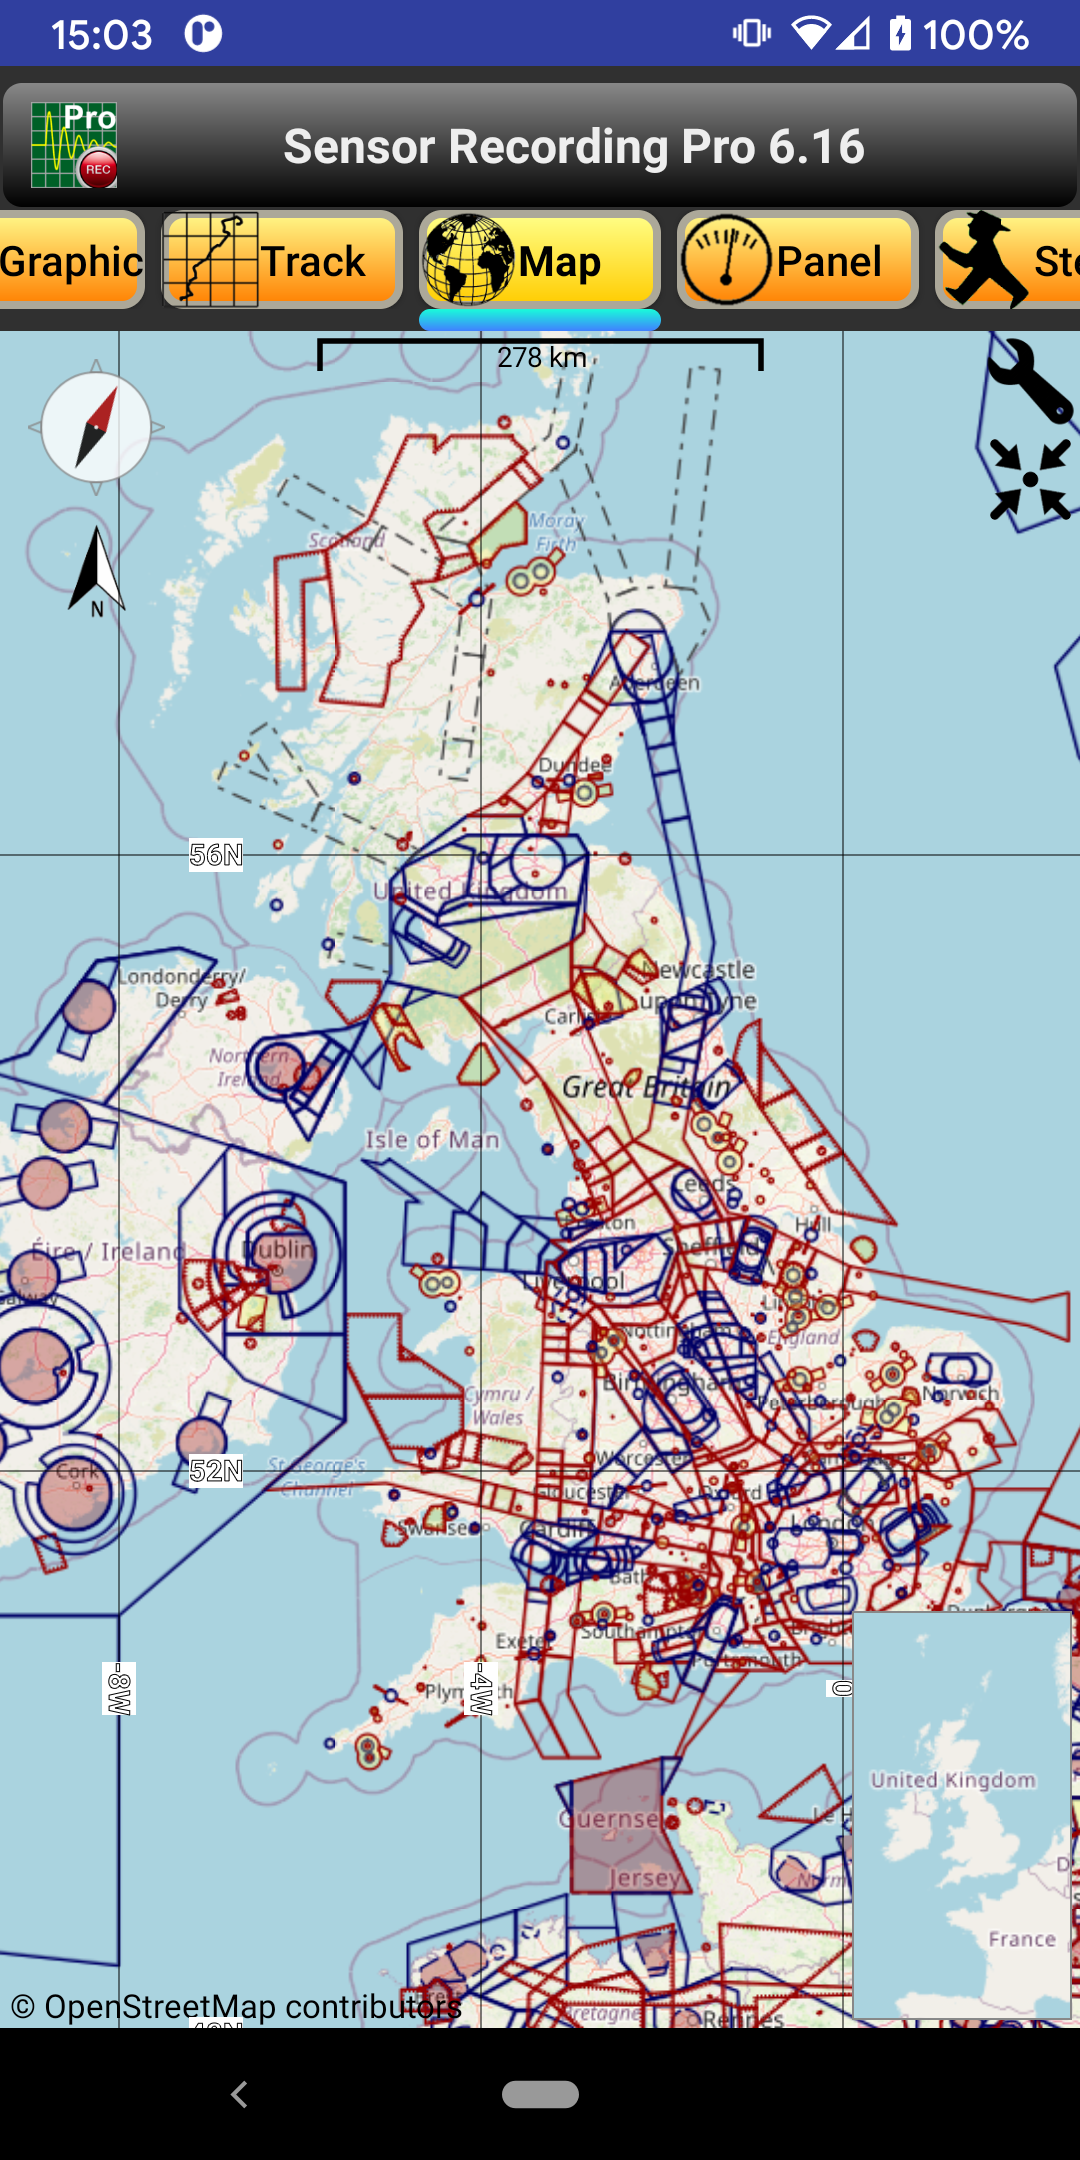
As of version 8.16 there is the option to display an "Aviation Chart worldwide". For that, you need a personal API key (Client ID Token), which is available free of charge on https://www.openaip.net. In the directory "SensorRecording" there is a file named "APIkeys.ini". The related entry is "openaipAPIkey=YourClientIDToken".
The satellite images for the map type \"Weather Maps separate\" were provided by the website https://en.sat24.com until end of 2023. This service appears to have been discontinued. That\'s why from version 9.23 the images are retrieved from https://www.meteoplaza.com. However, only for the European area, either visual (only during the day) or infrared (also at night).
Since version 9.34 there are also various warning maps from the DWD (German Weather Service), e.g. for thunderstorms, rain, wind, fog. etc. See also here: https://www.wettergefahren.de/warnungen/warnsituation.html.