Sensor Recording
Discover your Android Smartphone!
Readout, display and record smartphone sensor data

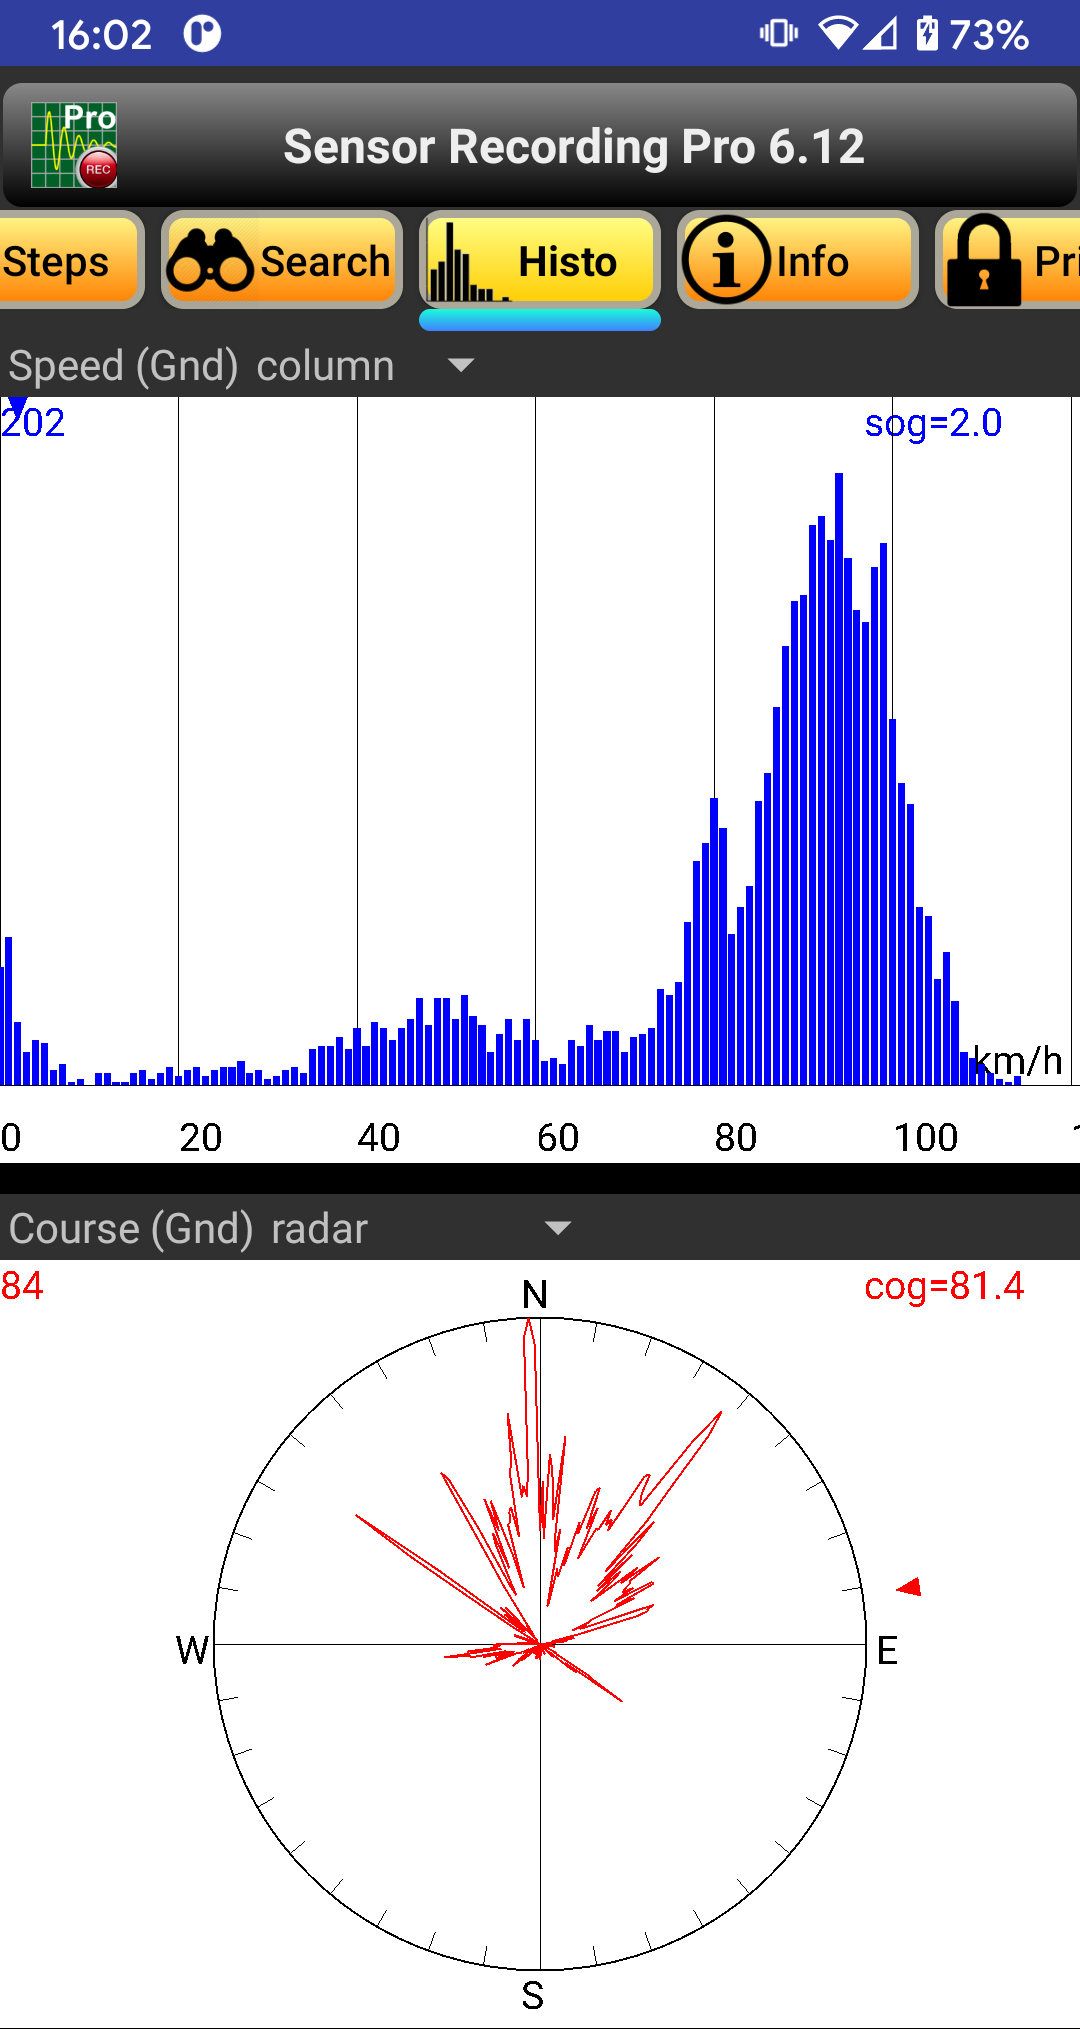
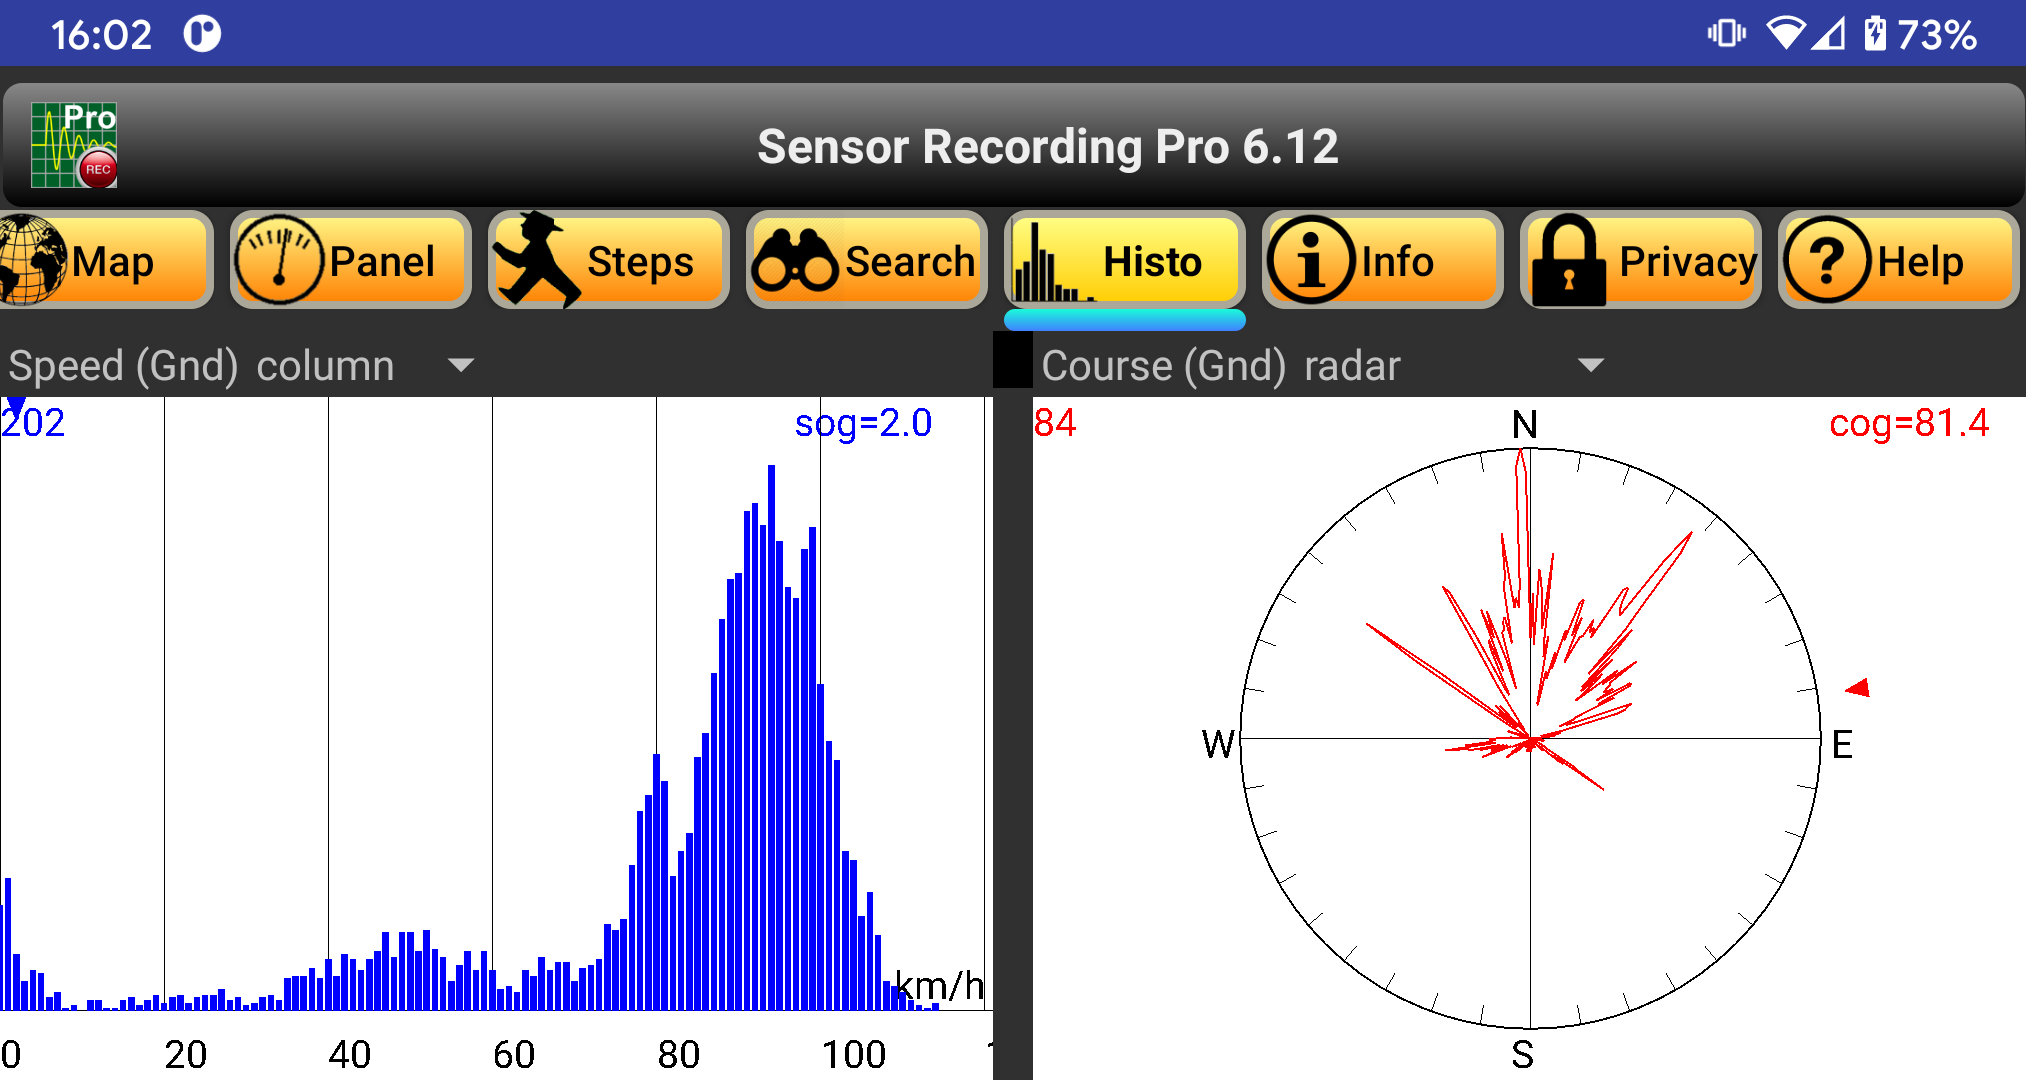
Sensor Recording - Histogram
Statistical function, showing the frequency of course and speed data as histogram.
The scale is adjusted automatically to the measured data sets.
The data can be displayed in two ways: either as line or column diagram.
For the course data there is an additional option: it can also be shown as
"radar" plot, i.e. a circular presentation.